
Recipe costing tells you what a menu item should use. A month-end actual-versus-theoretical comparison asks a different question: did the ingredients you actually used line up with what the recipes say you should have used for the items sold? It is a practical way to spot a count, recording, portioning or waste issue—not a verdict about a staff member.
This worked example uses invented figures for a small café. For simplicity, the café includes coffee and other beverage ingredients in both its cost and sales figures. If you report food-only separately, keep food and beverage costs and sales consistently separated on both sides.
Actual and theoretical cost: two different views
Actual food cost is the cost of inventory used during a period, estimated from the stock on hand and purchases received: beginning inventory + purchases − ending inventory. Divide that result by food sales for the same period to get the actual cost percentage. The IRS’s Publication 334 describes the beginning-inventory, purchases and ending-inventory structure for cost of goods sold. This monthly management comparison is not tax advice: inventory valuation and reporting rules depend on the business and its accounting method, so confirm tax treatment with a qualified professional.
Theoretical food cost estimates ingredient cost for the menu items recorded as sold: units sold of each item × its current recipe cost, summed across the menu. The recipe costs need current ingredient prices, realistic yields and serving portions. If you need to build that foundation first, see this worked recipe-cost-per-portion example.
Variance is actual cost minus theoretical cost. You can show it as dollars and as percentage points of sales. A positive amount means actual usage cost came out higher than the recipes predict; it does not tell you why. Neither a universal acceptable variance nor a single industry ratio can diagnose your café.
A month-end example, step by step
Assume the café starts the month with $3,100 of food and beverage inventory, receives $9,400 of food and beverage purchases during the month, and counts $2,900 at the end. Its matching menu sales for the month are $30,000, excluding sales tax collected for the government and using the same treatment of refunds, discounts and comps as the sales report.
Actual cost used = $3,100 + $9,400 − $2,900 = $9,600. Actual cost percentage = $9,600 ÷ $30,000 = 32.0%.
Now estimate theoretical usage from current recipe costs and units sold. Five major items plus a pooled “everything else” line could look like this:
- Breakfast sandwiches: 900 sold × $2.40 recipe cost = $2,160
- Lattes: 1,400 × $0.78 = $1,092
- Drip coffee: 1,100 × $0.31 = $341
- Pastries: 1,000 × $1.05 = $1,050
- Salads: 400 × $3.30 = $1,320
- Everything else: summed current recipe costs for remaining items = $2,887
Theoretical cost = $2,160 + $1,092 + $341 + $1,050 + $1,320 + $2,887 = $8,850. Theoretical percentage = $8,850 ÷ $30,000 = 29.5%. So the variance is $9,600 − $8,850 = $750, or 32.0% − 29.5% = 2.5 percentage points of sales. That is a difference to investigate, not proof of waste or theft.
For context only, the National Restaurant Association’s 2025 Operations Data Abstract reported 2024 median food and non-alcoholic beverage costs of 32.4% of sales among limited-service respondents and 32.0% among full-service respondents. The report drew on data from more than 900 restaurant operators and says its figures are management comparisons, not standards or goals. A small café’s menu, accounting choices and operation may differ; see the guide to interpreting restaurant food-cost benchmarks and the Association’s 2025 report summary.
Drill down on one ingredient
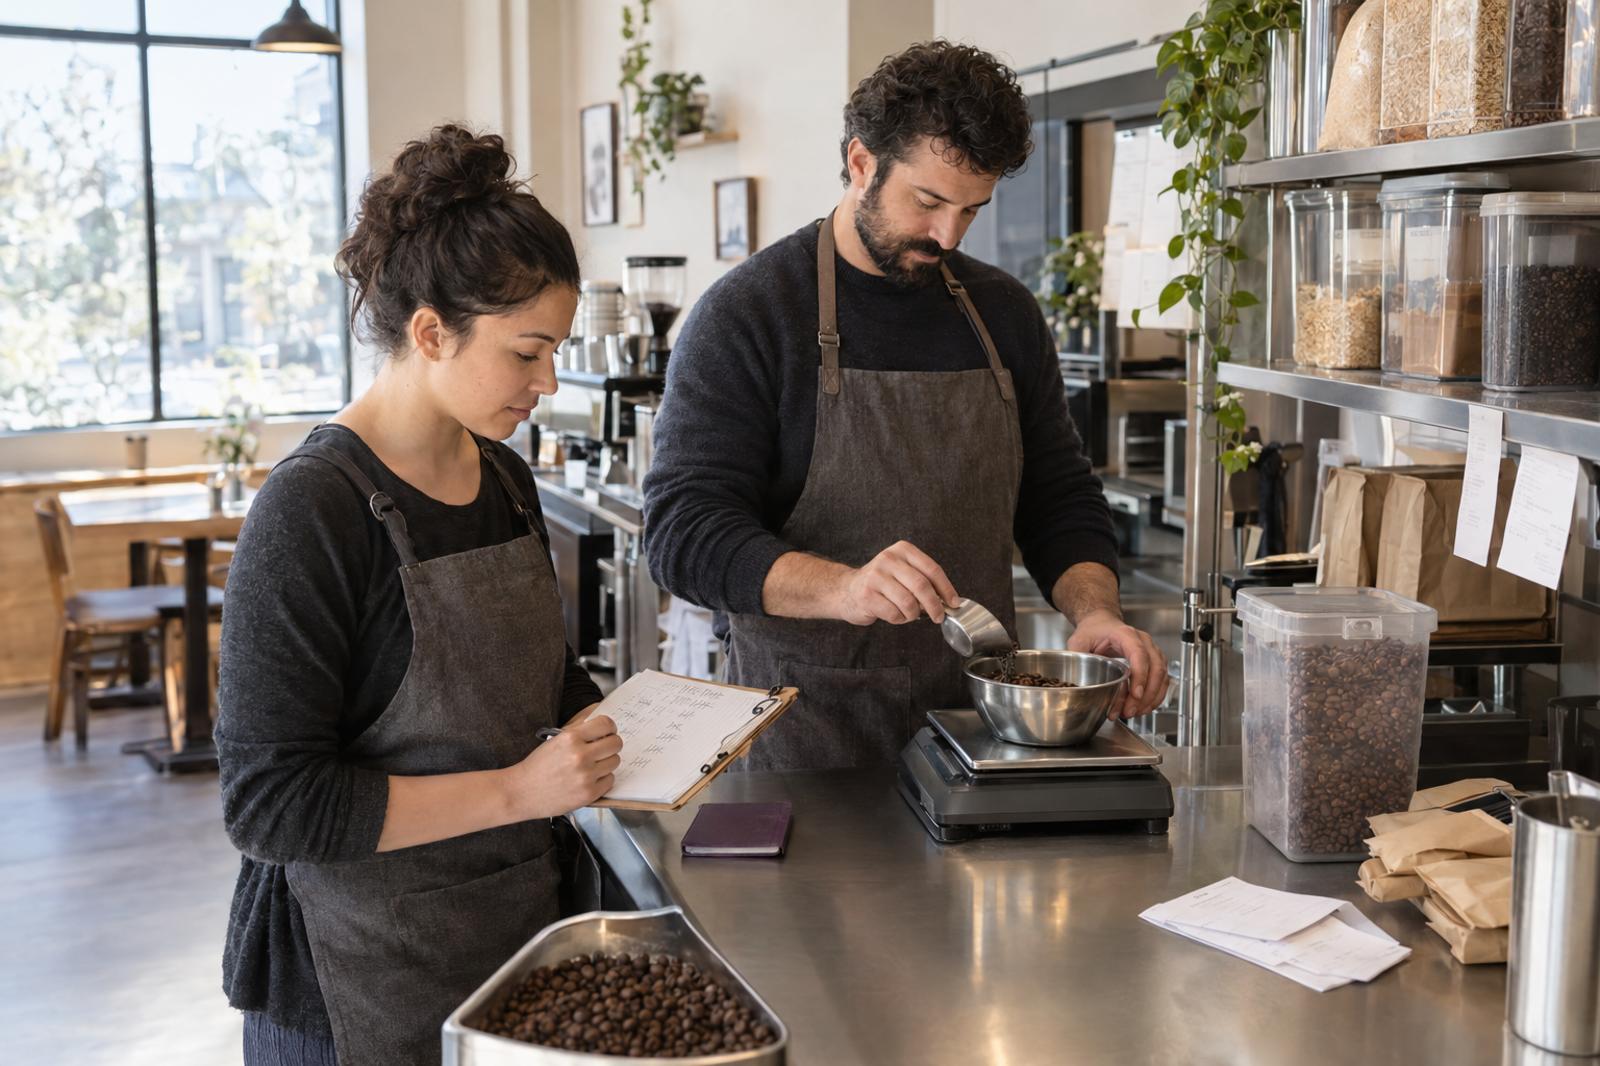
Suppose the café wants to inspect espresso beans. It counts 8 kg at the start, receives 25 kg, and counts 7 kg at month-end: 8 + 25 − 7 = 26 kg actually used. Its recipe cards predict 900 espresso drinks × 18 g (16.2 kg) plus 400 filter coffees × 20 g (8 kg), or 24.2 kg theoretically used. The 1.8 kg difference is about $39.60 at an illustrative latest invoice price of $22 per kg.
This small drill-down gives you a more useful question than “why is the whole month off?” Check whether the count and purchase units match, then look at espresso calibration, drinks remade, staff drinks, dial-in or cleaning use, recipe portions and sales records. The math is only as reliable as the count, recipe, price and sales data behind it.
Make the monthly count repeatable
Choose the same day and time each month—ideally when deliveries and kitchen activity can be paused briefly—and use a consistent shelf-to-sheet route. Count in the units you purchase or use, such as unopened cases plus loose pounds, kilograms or eaches; convert consistently. Have one person count and another verify the costliest or hardest-to-measure items where practical. Carefully recount the most expensive items (often a small share of the list), while still capturing the rest of the inventory rather than estimating it away.
Value the count consistently at a documented cost basis. For a quick operating review, a latest-invoice estimate can help surface changes, but it is not automatically the right tax inventory method. Confirm your business’s appropriate method with your bookkeeper or tax professional and apply it consistently. Record purchases by the date goods were received for this period comparison, not simply the date the bill was paid. A delivery arriving after the count belongs to the next period’s receiving cutoff; keep its invoice and receiving record together. This receiving routine can help keep the delivery evidence straight.
Copy-ready month-end variance worksheet
- Period and count cutoff (date/time): ____________________
- Beginning inventory at documented cost: $________
- Purchases received inside the period, less returns/credits: $________
- Ending inventory at the same cost basis: $________
- Actual cost used = beginning + received purchases − ending: $________
- Food or food-and-beverage sales on the matching basis: $________
- Actual cost percentage = actual cost ÷ matching sales: ________%
- Theoretical cost from units sold × current recipe costs: $________
- Theoretical percentage = theoretical cost ÷ matching sales: ________%
- Dollar variance = actual − theoretical: $________
- Percentage-point variance = actual percentage − theoretical percentage: ________ points
- Most likely cause to test, owner and due date: ____________________
Keep a short note for each adjustment—supplier credit, late delivery, count correction or documented waste—so next month’s starting point is explainable. A weekly food-business closeout can catch missing purchase or sales records before the month-end comparison grows harder to untangle.
Investigate the gap in this order
- Recheck counts and cutoff. Confirm units, conversions, shelf locations, omitted storage areas and deliveries just before or after the count. Check that opening inventory matches the prior close.
- Reconcile purchases. Look for a received delivery posted in the wrong month, a missing credit, a duplicate entry, or a non-food supply included in food purchases. Compare invoices to receiving notes; do not use payment date as a substitute for receipt date.
- Check recipe and sales data. Re-cost changed ingredients, verify yield and portion sizes, and check whether menu item counts match the same period and sales basis. Recipe cards that are stale make theoretical cost look artificially low.
- Review unrecorded use and waste. Check prep loss, spoilage, remakes, staff meals, sampling and over-portioning. A simple food waste log can help distinguish recurring causes from a one-off month.
- Then check comps, voids and other exceptions. A comp may use ingredients without appearing in paid sales; a void may or may not mean the food was remade. Trace a few exceptions back to tickets and records before changing the calculation.
- Leave theft as the last hypothesis. First rule out ordinary count, recipe, receiving and recording errors. A variance by itself is not evidence against a person; follow fair, documented procedures if there is specific evidence of misconduct.
Never re-serve food or change date marks to make a variance look smaller. Handle food according to your food-safety plan and local health requirements; accounting cleanup is never a reason to compromise safety.
Choose one correction for next month
Pick one cause you can test: recount the highest-cost items with a second person, update one recipe card, standardize a scoop or scale check, or add a waste/staff-meal entry to the daily close. Assign an owner and review the same measure next month. If the variance persists, repeat the count and cutoff checks before widening the investigation.
You can also use count data to estimate a basic par for the ten costliest items: average daily usage × days until the next delivery + a modest cushion. Treat it as a planning estimate, not an automatic alert or a substitute for checking shelf life, supplier lead times and delivery schedules.
Ququ Food’s current description covers menu products and recipes, recording purchases and sales with amounts and dates, and reviewing income, expenses and margin; its site says Food purchases and sales flow into Ququ Finance’s budget and cash flow. It does not replace a physical count or automatically calculate this actual-versus-theoretical variance. If that recordkeeping workspace fits your process, see Ququ Food.